Naturalization Statistics
The United States has a long history of welcoming immigrants from all parts of the world. During the last decade, USCIS welcomed more than 7.7 million naturalized citizens into the fabric of our nation.
Deciding to become a U.S. citizen is an important milestone in an immigrant’s life. Candidates for citizenship must show they are committed to the unifying principles that bind us as Americans. For that commitment, in return, they will enjoy the rights and privileges fundamental to U.S. citizenship.
Fiscal Year 2023 Naturalization Statistics1
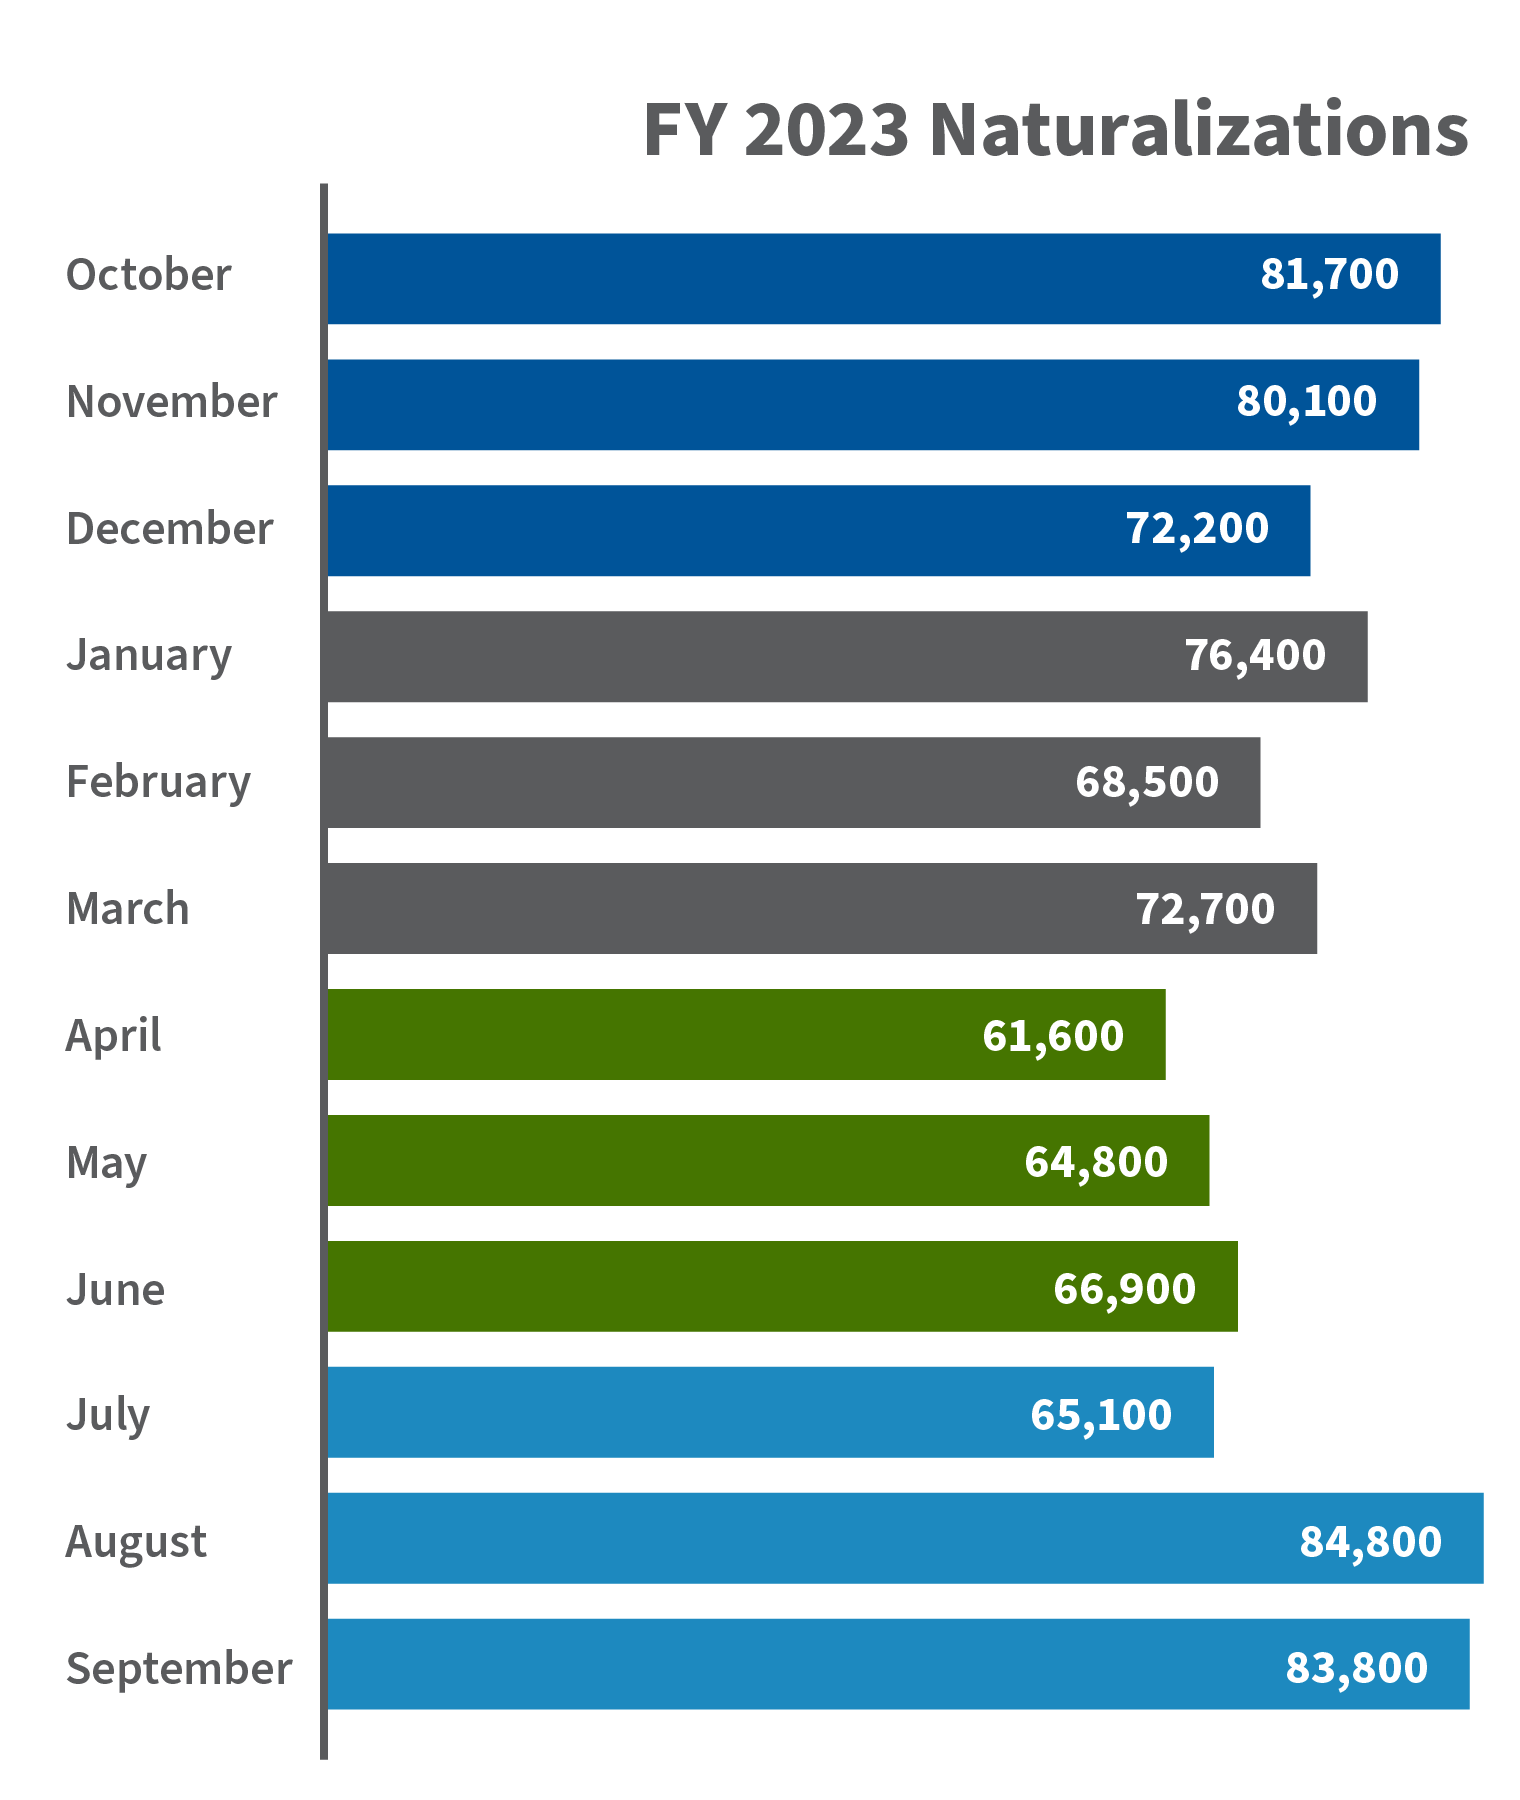
USCIS welcomed 878,500 new citizens in fiscal year 2023 during naturalization ceremonies held across the United States and around the world. Naturalizations in fiscal years 2022 and 2023 made up nearly a quarter (24%) of all naturalizations over the past decade.
Monthly Naturalizations in FY 2023
USCIS was able to return to normal year production levels for naturalization applications in FY 2021 despite limitations due to the COVID-19 pandemic; and in FY 2023, USCIS production levels for naturalization applications continue to surpass pre-pandemic levels.
The Dallas (4.1% of all naturalizations), Houston (4.1%), Chicago (3.7%), Newark (3.4%), and San Francisco (2.9%) field offices naturalized the largest number of new citizens in FY 2023.
Countries of Birth
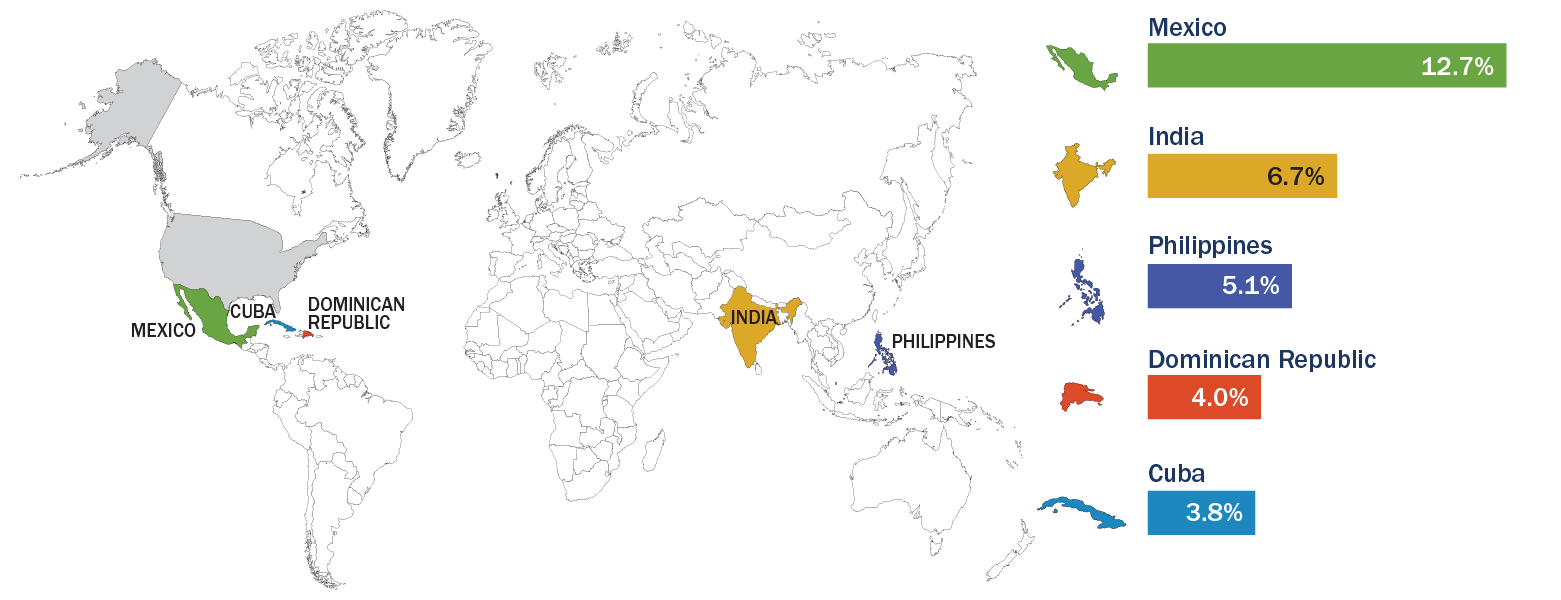
Among the top five countries of birth for people naturalizing in FY 2023, Mexico was the lead country, with 12.7% of all naturalizations, followed by India (6.7%), the Philippines (5.1%), the Dominican Republic (4.0%), and Cuba (3.8%). The top five countries of birth comprised 32% of the naturalized citizens in FY 2023.
State, City/Borough, and Core-Based Statistical Area of Residence
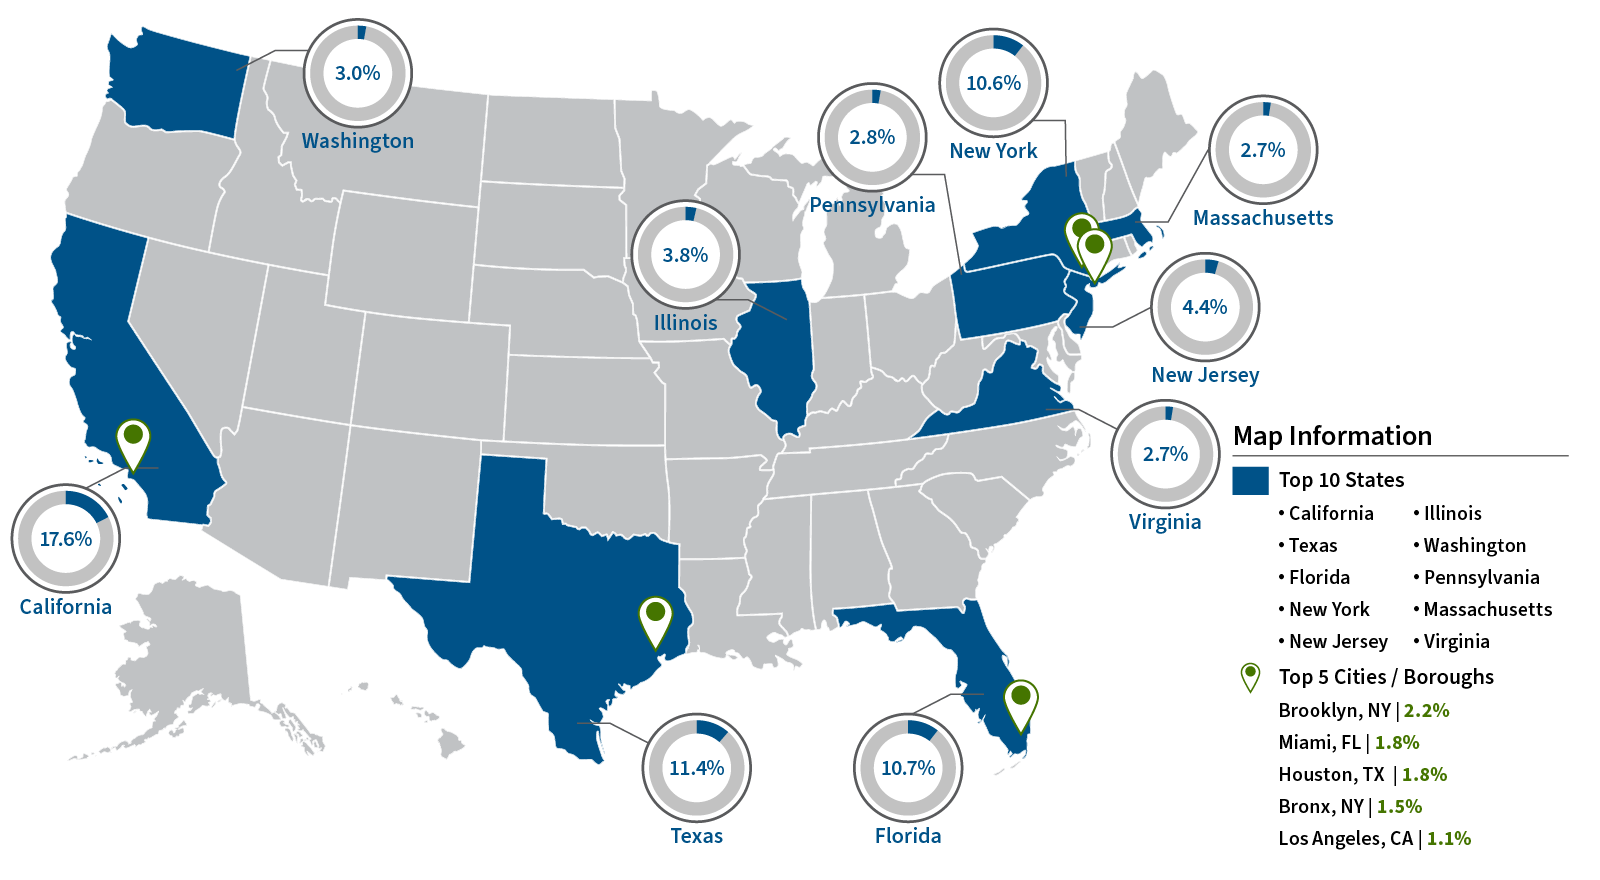
Applicants who submit a Form N-400, Application for Naturalization, list their current address on the form. Using this information, USCIS can determine the state of residence at the time a person applied for naturalization. Of all citizens naturalized in FY 2023, 70% resided in 10 states (in descending order): California, Texas, Florida, New York, New Jersey, Illinois, Washington, Pennsylvania, Massachusetts, and Virginia. More than 50% resided in the top four states.
The top five cities (including boroughs) where people who naturalized resided were (in descending order): Brooklyn, Miami, Houston, the Bronx, and Los Angeles.
The top five Core Based Statistical Areas (CBSAs) where people who naturalized resided were (in descending order): New York-Newark-Jersey City (13.5%), Los Angeles-Long Beach-Anaheim (6.4%), Miami-Fort Lauderdale-Pompano Beach (5.8%), Houston-The Woodlands-Sugar Land (3.9%), and Dallas-Fort Worth-Arlington (3.7%).
Age and Gender2
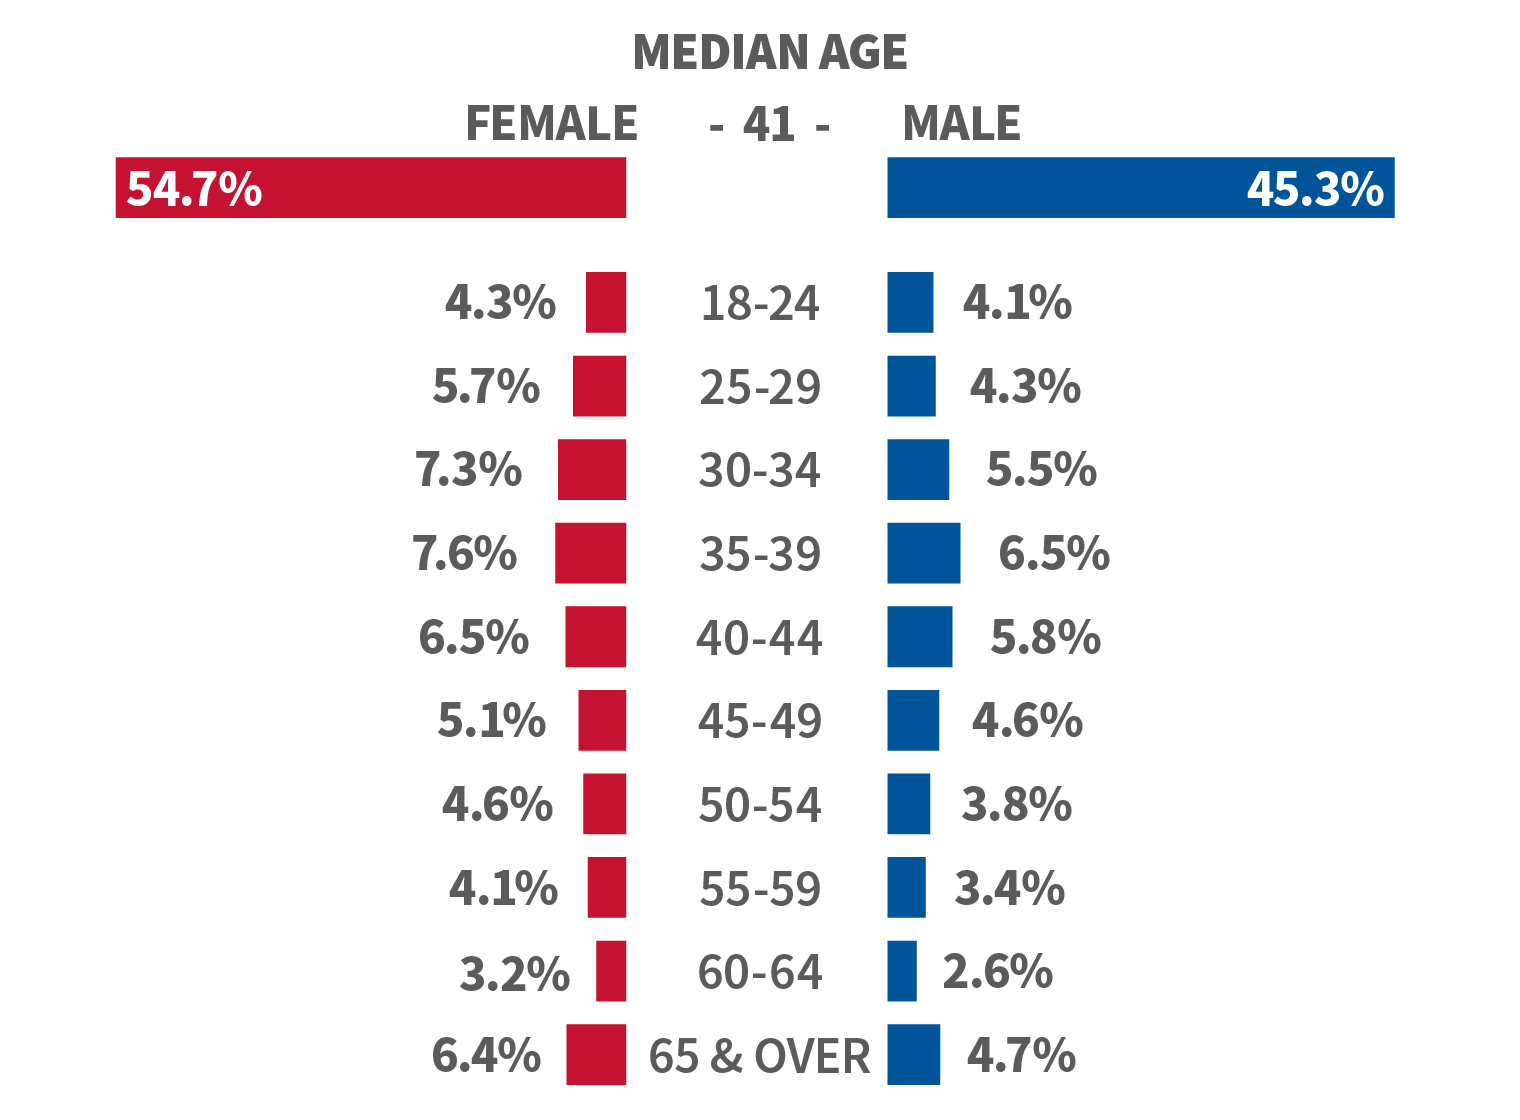
More than 39% of citizens naturalized in FY 2023 were 30 to 44 years old. The median age of those naturalizing in FY 2023 was 41 years. About 18% were younger than 30 years old, and 37 new citizens were centenarians (age 100 and older)!
Women made up nearly 55% of those naturalized in FY 2023, and they were the majority in every age group. Twenty three of the 37 centenarians were women as well.
Naturalization Eligibility
To be eligible for naturalization, an applicant must fulfill certain eligibility requirements set forth in the Immigration and Nationality Act (INA). The requirements generally include being a lawful permanent resident (LPR) for at least five years. There are also other special naturalization provisions that exempt certain applicants, including certain spouses of U.S. citizens and applicants with military service, from one or more of the general requirements for naturalization. Most people who naturalized in FY 2023 were eligible for naturalization based on being LPRs for at least 5 years (INA Section 316(a)), followed by applicants who were eligible based on being LPRs for at least 3 years and married to a U.S. citizen for 3 years (INA Section 319(a)) and applicants who were eligible based on their military service during a designated period of hostilities (INA Section 329).
| Section of Law | Section of Law Description | Percent of Total |
|---|---|---|
| INA Section 316(a) | LPR for 5 years | 82.9% |
| INA Section 319(a) | LPR for 3 years (married to U.S. citizen 3 years) | 15.6% |
| INA Section 329 | Military service during designated period of hostilities | 1.4% |
| All other | All others | 0.1% |
In general, a noncitizen must spend at least 5 years as a lawful permanent resident to be eligible for naturalization while a spouse of a U.S. citizen must spend at least 3 years as a lawful permanent resident. The median years spent as an LPR for all citizens naturalized in FY 2023 was 7 years.

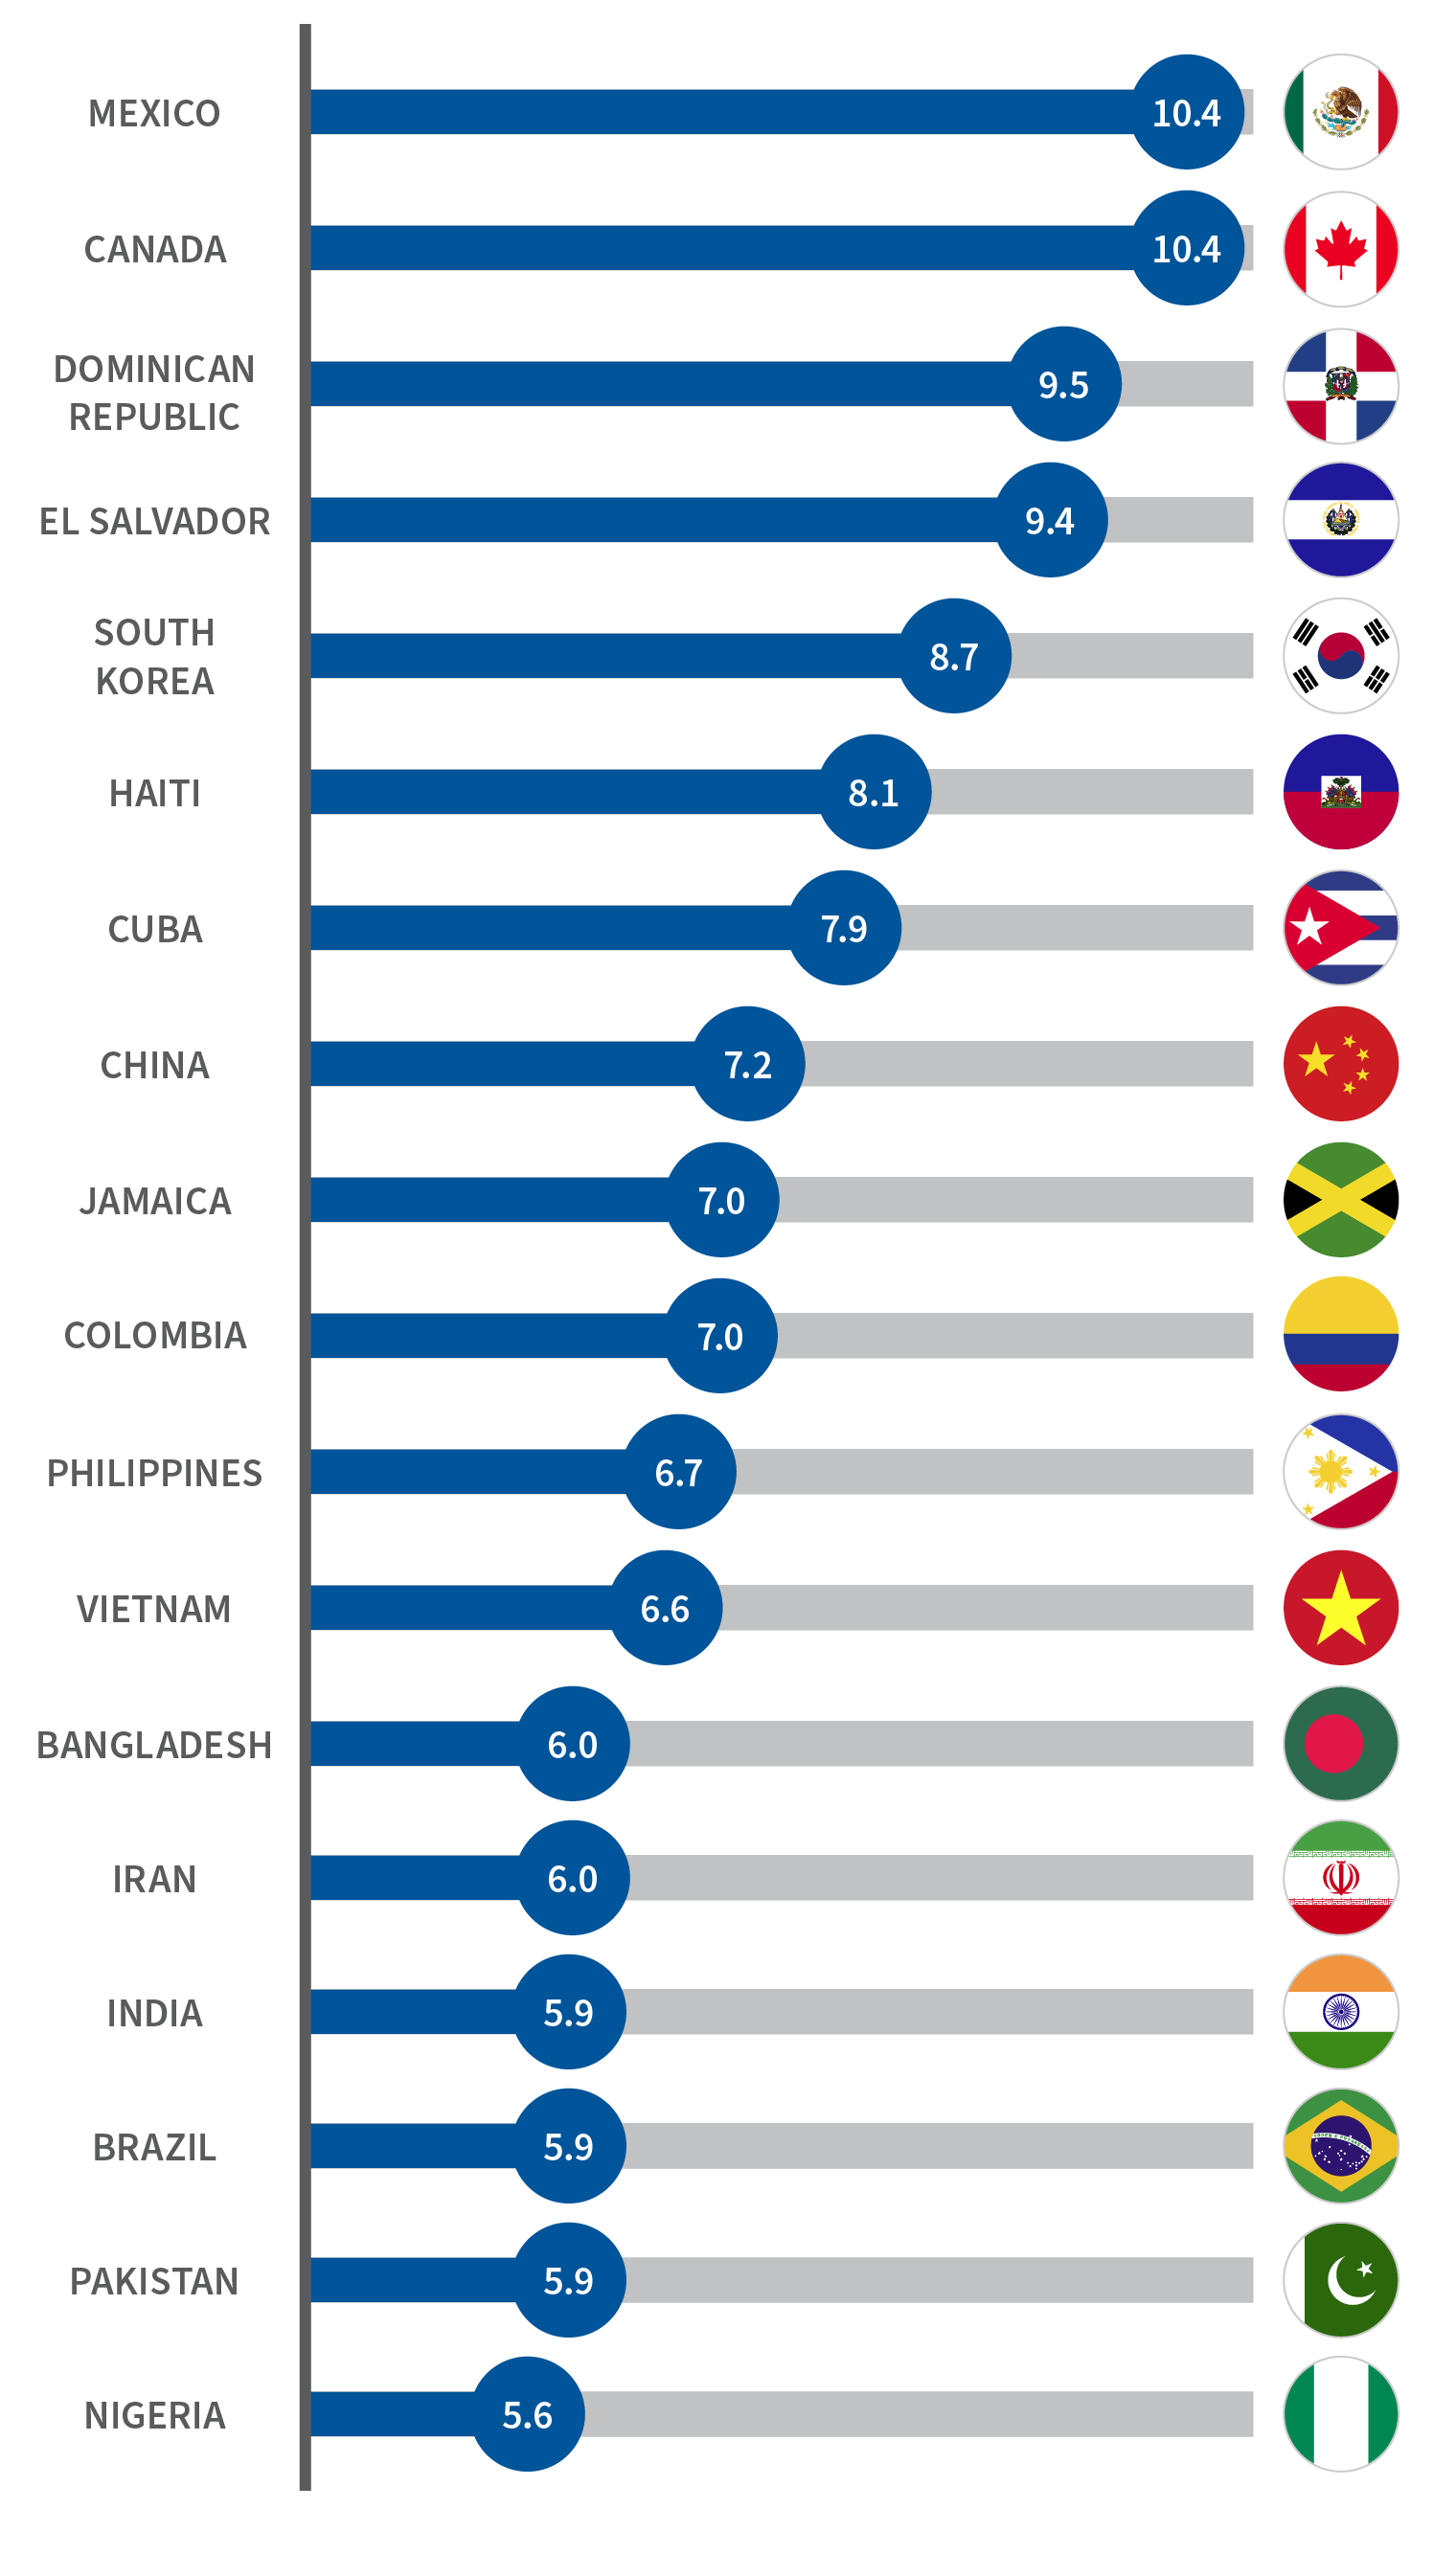
The median years spent as an LPR varied by the citizens’ country of birth. The countries with the largest number of new citizens in FY 2023 and their median years spent as an LPR are shown below. Out of these top countries, applicants from Mexico and Canada spent the longest time, with 10.4 years, and applicants from Nigeria spent the shortest, with 5.6 years.
Class of Admission
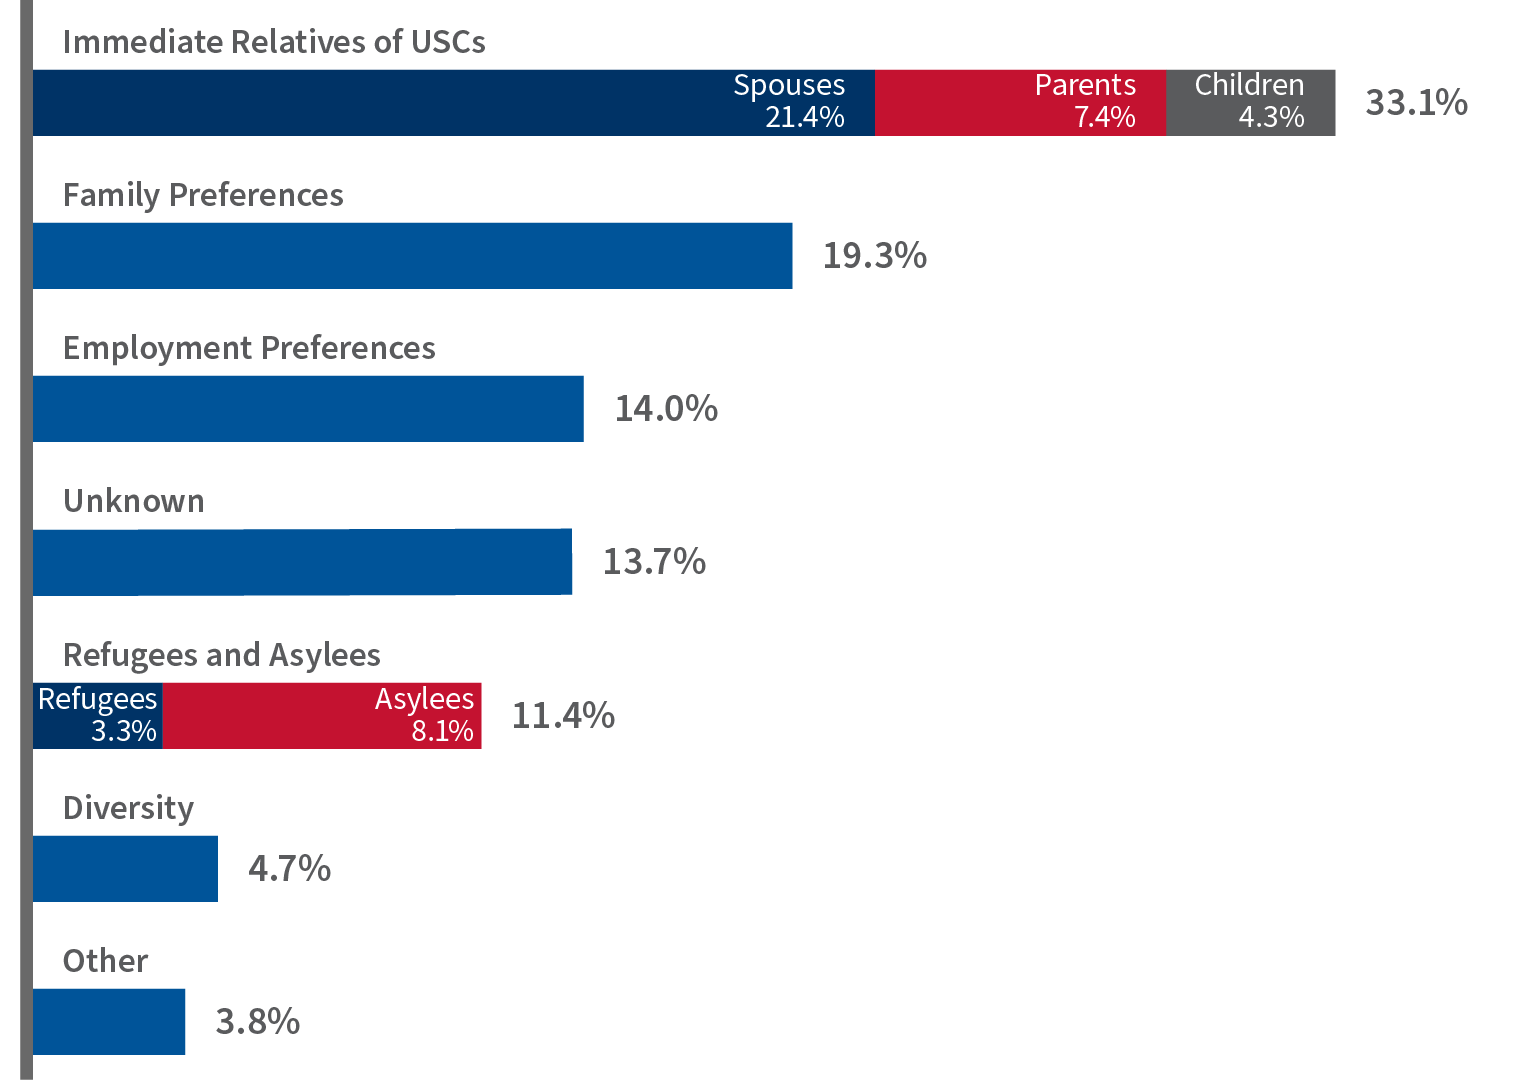
Most people who naturalized came to the United States as immediate relatives of U.S. citizens or through family-sponsored preference categories, followed by refugees and asylees, employment-based preference categories, and the Diversity Immigrant Visa Program.
Naturalization Test Initial Pass Rate
Section 312 of the INA requires that naturalization applicants demonstrate an ability to read, write, and speak words in ordinary usage in the English language and have a knowledge and understanding of U.S. history and government (civics). To meet these requirements and become naturalized citizens, applicants must pass an English test (which includes understanding, speaking, reading, and writing) and a civics test.
The naturalization test consists of two components: an English and a civics component. Applicants who fail one or both test components will have a second opportunity to pass the portions of the test that they failed, called a re-exam. The pass rate below represents the cumulative pass rate of applicants who took both the English test and the current version of the civics test since Oct. 1, 2022. It also counts those who were exempt from one of more portions of the naturalization test or had an approved Form N-648, Medical Certification for Disability Exceptions, as passing.
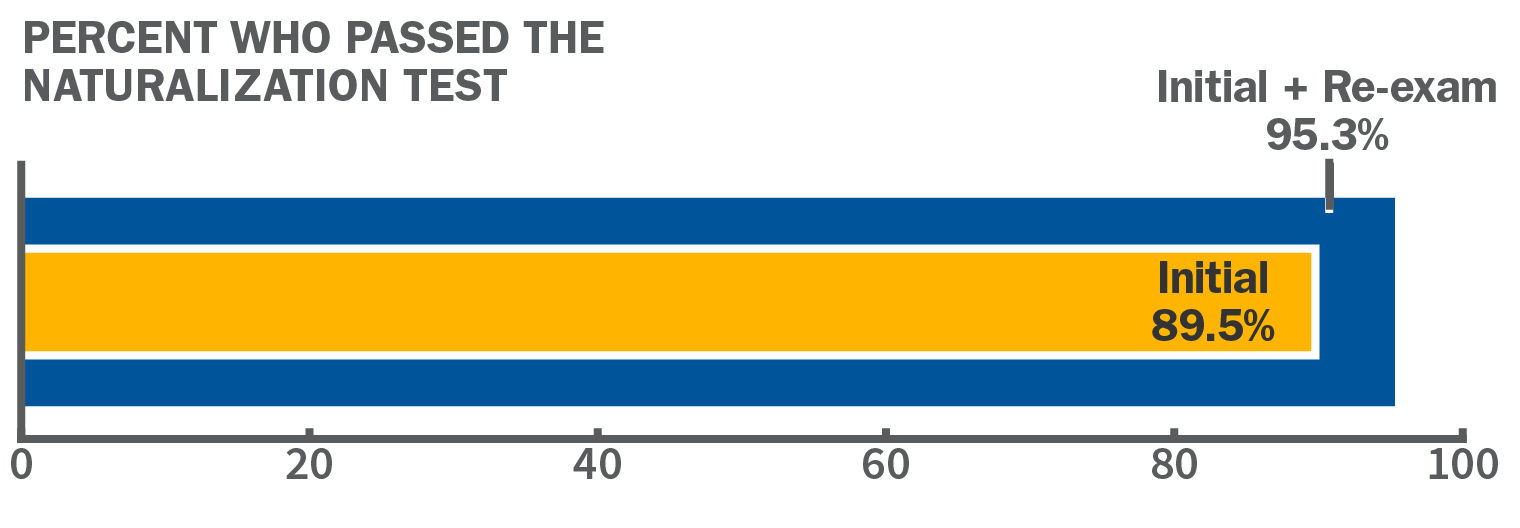
The first percentage (89.5%) denotes the pass rate of applicants who took the initial exam only and includes applicants who were exempt from one of more portions of the naturalization test or had an approved Form N-648. The second percentage (95.3%) denotes the pass rate of applicants who took the initial and re-exam and includes applicants who were exempt from one of more portions of the naturalization test or had an approved Form N-648.
Attorney or Accredited Representative
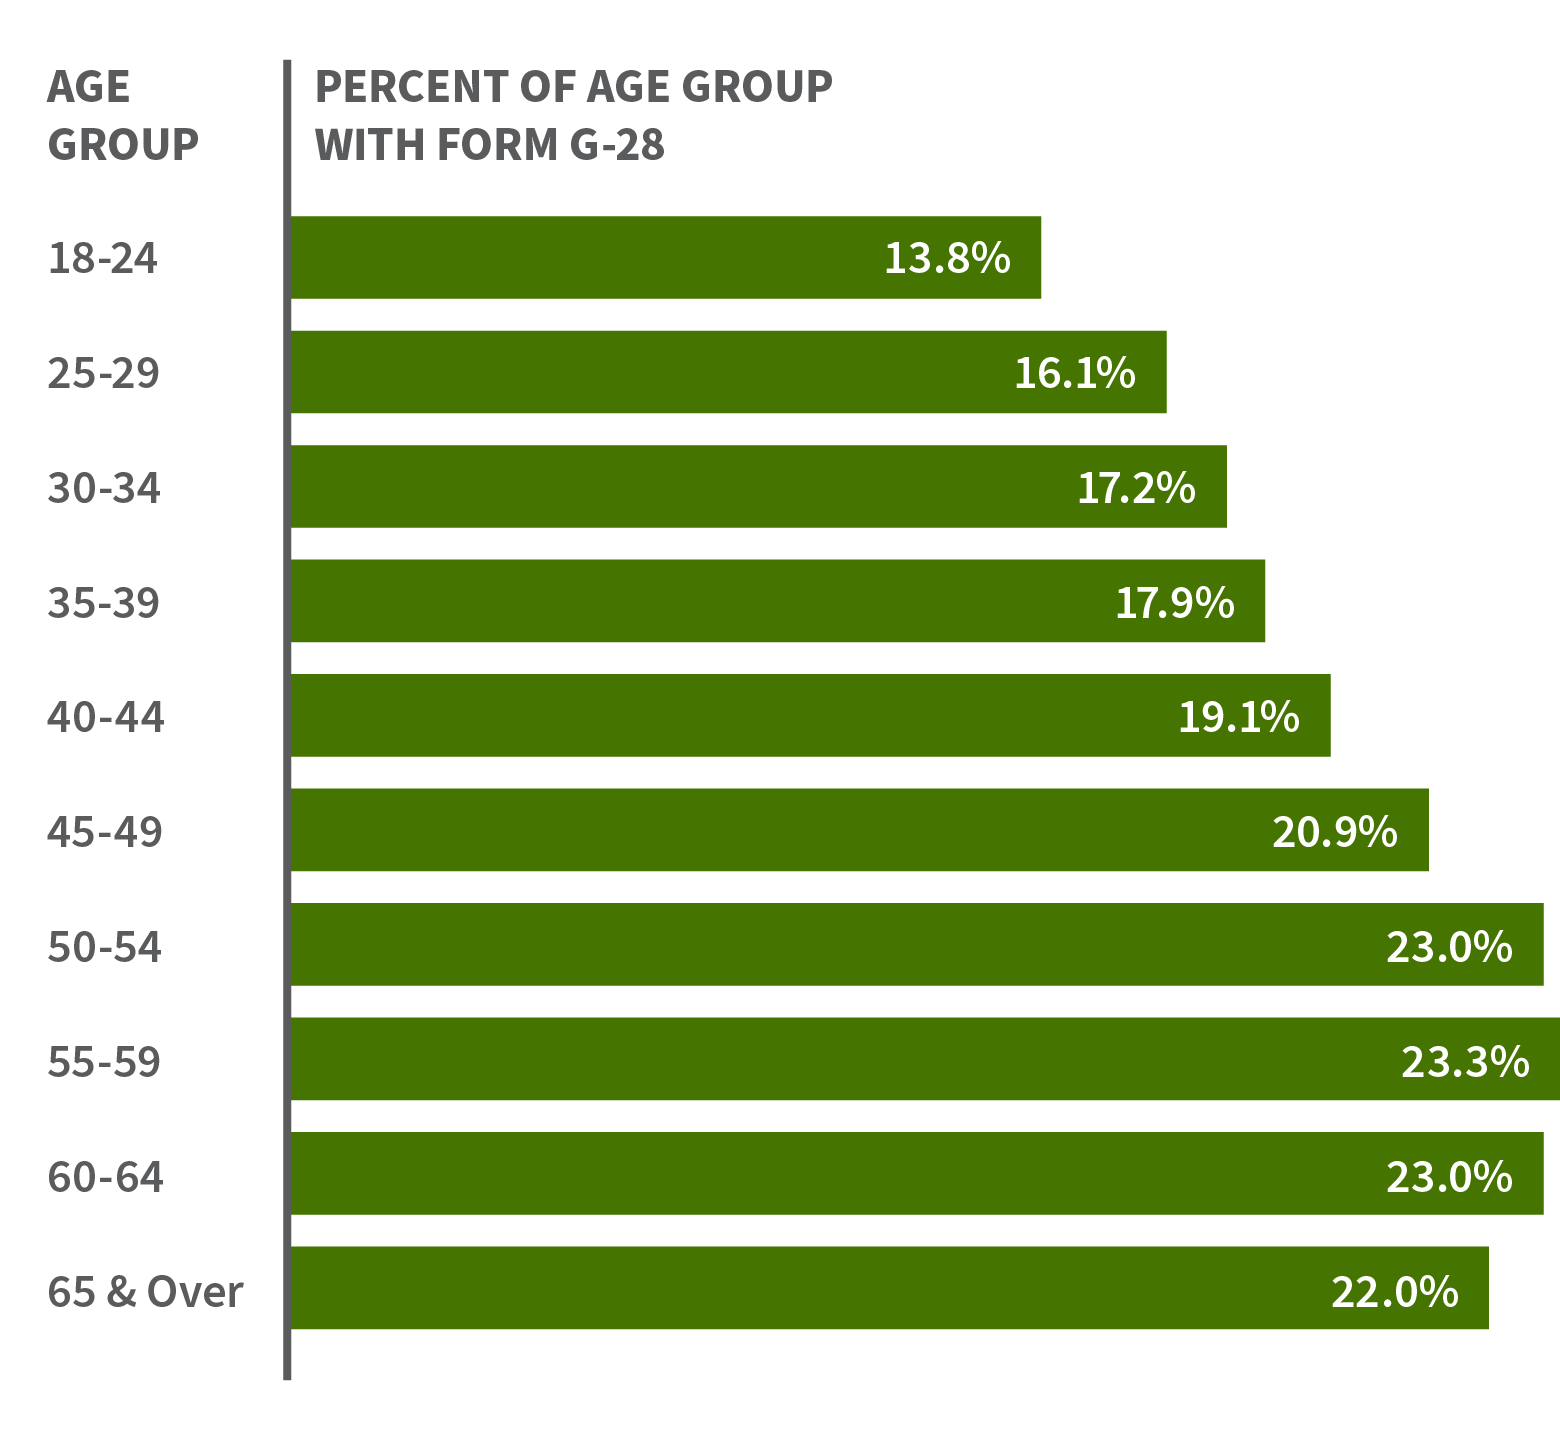
An attorney or accredited representative appearing before DHS must file Form G-28, Notice of Entry of Appearance as Attorney or Accredited Representative, in each case to establish their eligibility to represent a client in an immigration matter. In FY 2023, 19.3% of those naturalized had a Form G-28 filed by an attorney or accredited representative to represent them in their naturalization proceedings. Over 61% of all applicants who had a Form G-28 filed by an attorney or accredited representative were over the age of 40.
Fee Waiver5
USCIS is funded largely by application and petition fees. Recognizing that some applicants cannot pay the filing fees, USCIS established a fee waiver process for certain forms and benefit types, including the Form N-400, Application for Naturalization. USCIS will approve a fee waiver only if the applicant clearly demonstrates that they are unable to pay the filing fees. USCIS carefully considers the merits of each fee waiver request before making a decision.
| Fee Waiver Eligibility |
|---|
| The applicant, their spouse, or the head of their household receives a means-tested benefit. |
| The applicant’s household income is at or below 150 percent of the federal poverty guidelines at the time the applicant files. |
| The applicant is currently experiencing a financial hardship that prevents the applicant from paying the filing fee, including unexpected medical bills or emergencies. |
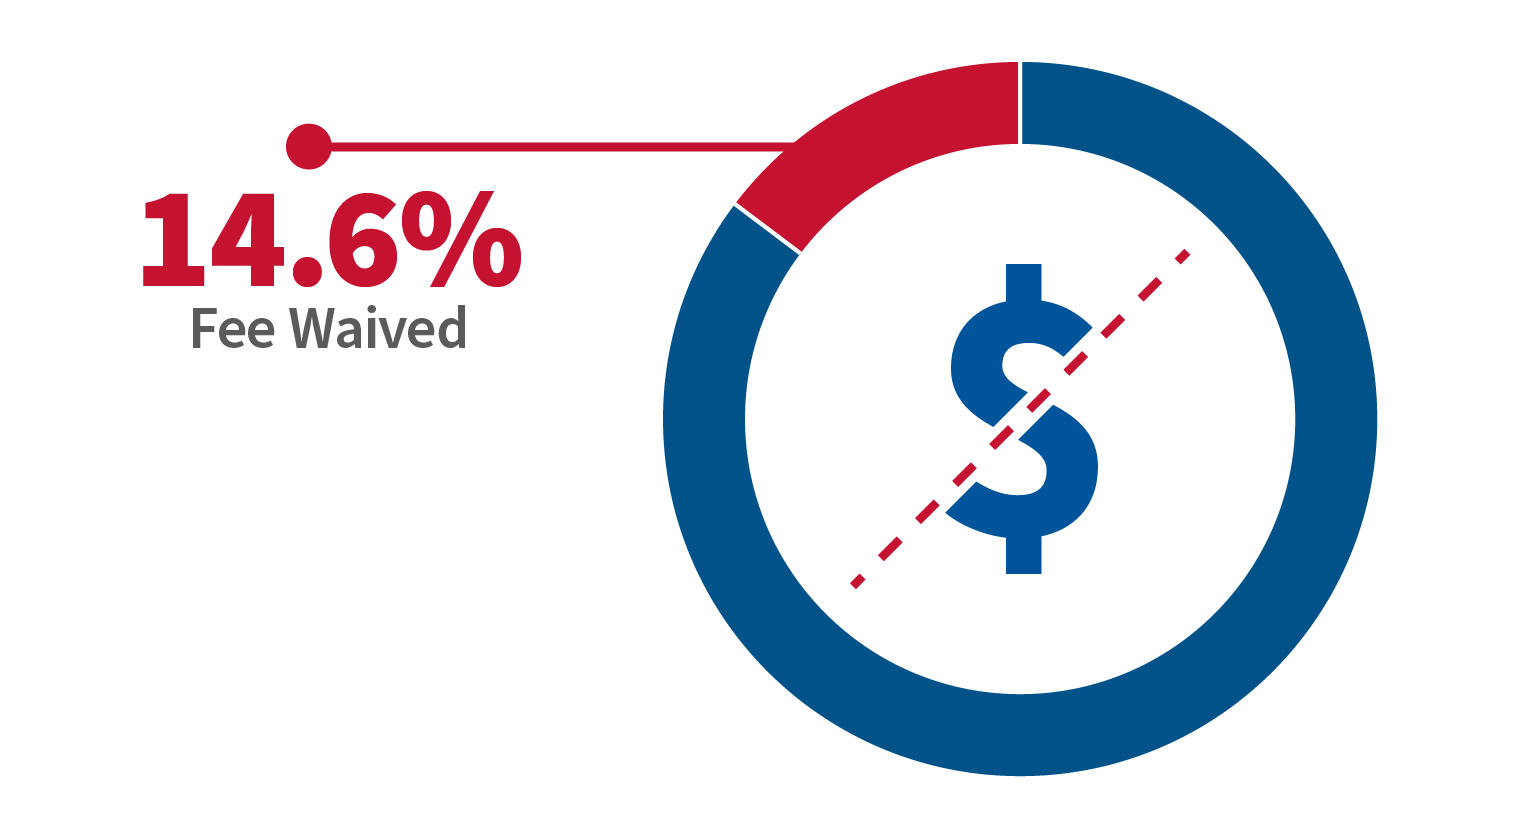
In FY 2023, 14.6% of those naturalized had an approved fee waiver. Females (9.1%) had more fee waivers than males (5.4%). Those 65 and older had the most fee waivers out of all age groups that naturalized in FY 2023 (3.7%).
More Naturalization Statistics
Naturalization receipts, approvals, denials, and pending applications by field office are also published quarterly on the USCIS Immigration and Citizenship Data page.
- FY 2023 Quarter 1 (PDF, 529.36 KB)
- FY 2023 Quarter 2 (PDF, 289.31 KB)
- FY 2023 Quarter 3 (PDF, 310.2 KB)
- FY 2023 Quarter 4 (PDF, 262.49 KB)
- Military Naturalization Statistics
- Characteristics of People Who Naturalized Between FY 2015 and FY 2019 (PDF, 910.74 KB)
- Trends in Naturalization Rates: FY 2018 Update (PDF, 311.33 KB)
- Naturalization Test Performance
Tables
| Country of birth | FY 2023 |
|---|---|
| Mexico | 111,500 |
| India | 59,100 |
| Philippines | 44,800 |
| Dominican Republic | 35,200 |
| Cuba | 33,200 |
| Vietnam | 32,800 |
| China | 25,800 |
| El Salvador | 21,100 |
| Jamaica | 20,200 |
| Colombia | 17,100 |
| All Others | 477,800 |
| Total | 878,500 |
Source: USCIS, ELIS. Data accessed November 2023.
Notes: Due to rounding, the totals may not sum.
| State of residence | FY 2023 |
|---|---|
| California | 154,900 |
| Texas | 99,900 |
| Florida | 94,100 |
| New York | 92,800 |
| New Jersey | 39,000 |
| Illinois | 33,300 |
| Washington | 26,100 |
| Pennsylvania | 25,000 |
| Massachusetts | 24,100 |
| Virginia | 24,100 |
| All Others | 265,200 |
| Total | 878,500 |
Source: USCIS, ELIS. Data accessed November 2023.
Notes: Due to rounding, the totals may not sum.
| City of residence | FY 2023 |
|---|---|
| Brooklyn | 19,400 |
| Miami | 15,800 |
| Houston | 15,700 |
| Bronx | 13,000 |
| Los Angeles | 9,300 |
| New York | 8,500 |
| Chicago | 8,500 |
| Las Vegas | 8,200 |
| San Jose | 7,000 |
| San Diego | 6,400 |
| All others | 766,600 |
| Total | 878,500 |
Source: USCIS, ELIS. Data accessed November 2023.
Notes: Due to rounding, the totals may not sum.
| CBSA of residence | FY 2023 |
|---|---|
| New York-Newark-Jersey City, NY-NJ-PA | 118,400 |
| Los Angeles-Long Beach-Anaheim, CA | 56,500 |
| Miami-Fort Lauderdale-West Palm Beach, FL | 50,800 |
| Houston-The Woodlands-Sugar Land, TX | 34,700 |
| Dallas-Fort Worth-Arlington, TX | 32,800 |
| Washington-Arlington-Alexandria, DC-VA-MD-WV | 31,700 |
| Chicago-Naperville-Elgin, IL-IN-WI | 31,000 |
| San Francisco-Oakland-Hayward, CA | 23,900 |
| Seattle-Tacoma-Bellevue, WA | 20,700 |
| Boston-Cambridge-Newton, MA-NH | 18,600 |
| All Others | 459,600 |
| Total | 878,500 |
Abbreviation: CBSA = Core-Based Statistical Area.
Source: USCIS, ELIS. Data accessed November 2023.
Notes: Due to rounding, the totals may not sum. Some zip codes have multiple CBSAs.
| Age group | Gender | Total | ||
|---|---|---|---|---|
| Female | Male | Unknown | ||
| 18-24 | 37,700 | 35,500 | 200 | 73,400 |
| 25-29 | 50,000 | 37,700 | 300 | 88,000 |
| 30-34 | 64,000 | 47,800 | 500 | 112,300 |
| 35-39 | 66,100 | 47,800 | 600 | 123,800 |
| 40-44 | 57,300 | 50,800 | 500 | 108,500 |
| 45-49 | 44,200 | 40,000 | 400 | 84,600 |
| 50-54 | 40,200 | 33,400 | 300 | 74,000 |
| 55-59 | 35,500 | 29,600 | 300 | 65,300 |
| 60-64 | 27,700 | 22,700 | 200 | 50,600 |
| 65 and Over | 55,900 | 41,500 | 500 | 97,900 |
| Total | 478,600 | 396,200 | 3,600 | 878,500 |
Source: USCIS, ELIS. Data accessed November 2023.
Notes: Due to rounding, the totals may not sum. There are some missing dates of birth.
| Class of admission | FY23 |
|---|---|
| Immediate relatives of U.S. citizens | 291,100 |
| Spouses | 188,200 |
| Parents | 64,800 |
| Children | 38,100 |
| Family preferences | 169,200 |
| Refugees and asylees | 100,100 |
| Refugees | 29,000 |
| Asylees | 71,100 |
| Employment preferences | 123,000 |
| Diversity | 120,700 |
| Unknown | 41,300 |
| Other | 33,200 |
| Total | 878,500 |
Source: USCIS, ELIS. Data accessed November 2023.
Notes: Due to rounding, the totals may not sum.
| Age group | G-28 | Total | |
|---|---|---|---|
| No | Yes | ||
| 18-24 | 63,200 | 10,200 | 73,400 |
| 25-29 | 73,900 | 14,200 | 88,000 |
| 30-34 | 93,000 | 19,300 | 112,300 |
| 35-39 | 101,600 | 22,200 | 123,800 |
| 40-44 | 87,800 | 20,700 | 108,500 |
| 45-49 | 66,900 | 17,700 | 84,600 |
| 50-54 | 57,000 | 17,000 | 74,000 |
| 55-59 | 50,100 | 15,200 | 65,300 |
| 60-64 | 38,900 | 11,600 | 50,600 |
| 65 and Over | 76,300 | 21,600 | 97,900 |
| Total | 708,800 | 169,700 | 878,500 |
Source: USCIS, ELIS. Data accessed November 2023.
Notes: Due to rounding, the totals may not sum.
| Gender | Fee Waiver | Total | |
|---|---|---|---|
| No | Yes | ||
| Female | 399,000 | 79,600 | 478,600 |
| Male | 348,500 | 47,700 | 396,200 |
| Unknown | 3,200 | 500 | 3,600 |
| Total | 750,700 | 127,800 | 878,500 |
Source: USCIS, ELIS. Data accessed November 2023.
Notes: Due to rounding, the totals may not sum.
| Age group | Fee Waiver | Total | |
|---|---|---|---|
| No | Yes | ||
| 18-24 | 57,500 | 15,900 | 73,400 |
| 25-29 | 77,400 | 10,600 | 88,000 |
| 30-34 | 100,900 | 11,500 | 112,300 |
| 35-39 | 111,600 | 12,300 | 123,800 |
| 40-44 | 98,000 | 10,500 | 108,500 |
| 45-49 | 76,500 | 8,100 | 84,600 |
| 50-54 | 65,400 | 8,500 | 74,000 |
| 55-59 | 56,000 | 9,300 | 65,300 |
| 60-64 | 41,700 | 8,900 | 50,600 |
| 65 and Over | 65,700 | 32,200 | 97,900 |
| Total | 750,700 | 127,800 | 878,500 |
Source: USCIS, ELIS. Data accessed November 2023.
Notes: Due to rounding, the totals may not sum.
1 Due to system updates and adjudicative outcomes, these naturalization statistics may differ from statistics in data reports published on the USCIS Immigration and Citizenship Data webpage and by the Office of Homeland Security Statistics.
2 Age and gender statistics are after removing unknowns. Counts with unknowns can be found in Data Table 5.
3 Read more information on the general eligibility requirements for naturalization on our website.
4 The median years spent as an LPR is based on the time between the date USCIS approved an individual’s adjustment of status application or when the individual entered the United States as an LPR and the date the individual took the Oath of Allegiance. In most cases, the effective date of LPR status is the date USCIS approves the applicant’s adjustment of status application or the date the applicant is admitted into the United States with an immigrant visa. For certain classifications, however, the effective date of becoming an LPR may be a date that is earlier than the actual approval of the status (commonly referred to as a “rollback” date). For example, a refugee is generally considered an LPR as of the date of entry into the United States, and an asylee is generally considered an LPR 1 year before the date USCIS approves the adjustment application. Thus, for asylees and refugees who adjust to LPR status, the time spent as an LPR may be shorter than the 5 year period generally required for naturalization because they are eligible to apply for naturalization 5 years from the rollback date.
5 Read more information on filing a fee waiver on our website. A reduced fee is not the same as a fee waiver and is not included in this analysis. Read more information on requesting a reduced filing fee on our website.
6 Current or former military members do not have to pay any fees for applying for naturalization under INA 328 or 329. The Department of Defense pays the application fees on their behalf. They are not included as part of the fee waiver group in this analysis.
