Military Naturalization Statistics
U.S. service members, veterans, and their families may be eligible for certain immigration benefits in recognition of their important sacrifices. Specifically, veterans and current service members may be eligible to become U.S. citizens through naturalization under special provisions of the Immigration and Nationality Act (INA). These provisions reduce or eliminate certain general requirements for naturalization, including the requirements for the applicant to have resided in and been physically present in the United States for a specific period of time before naturalizing.1
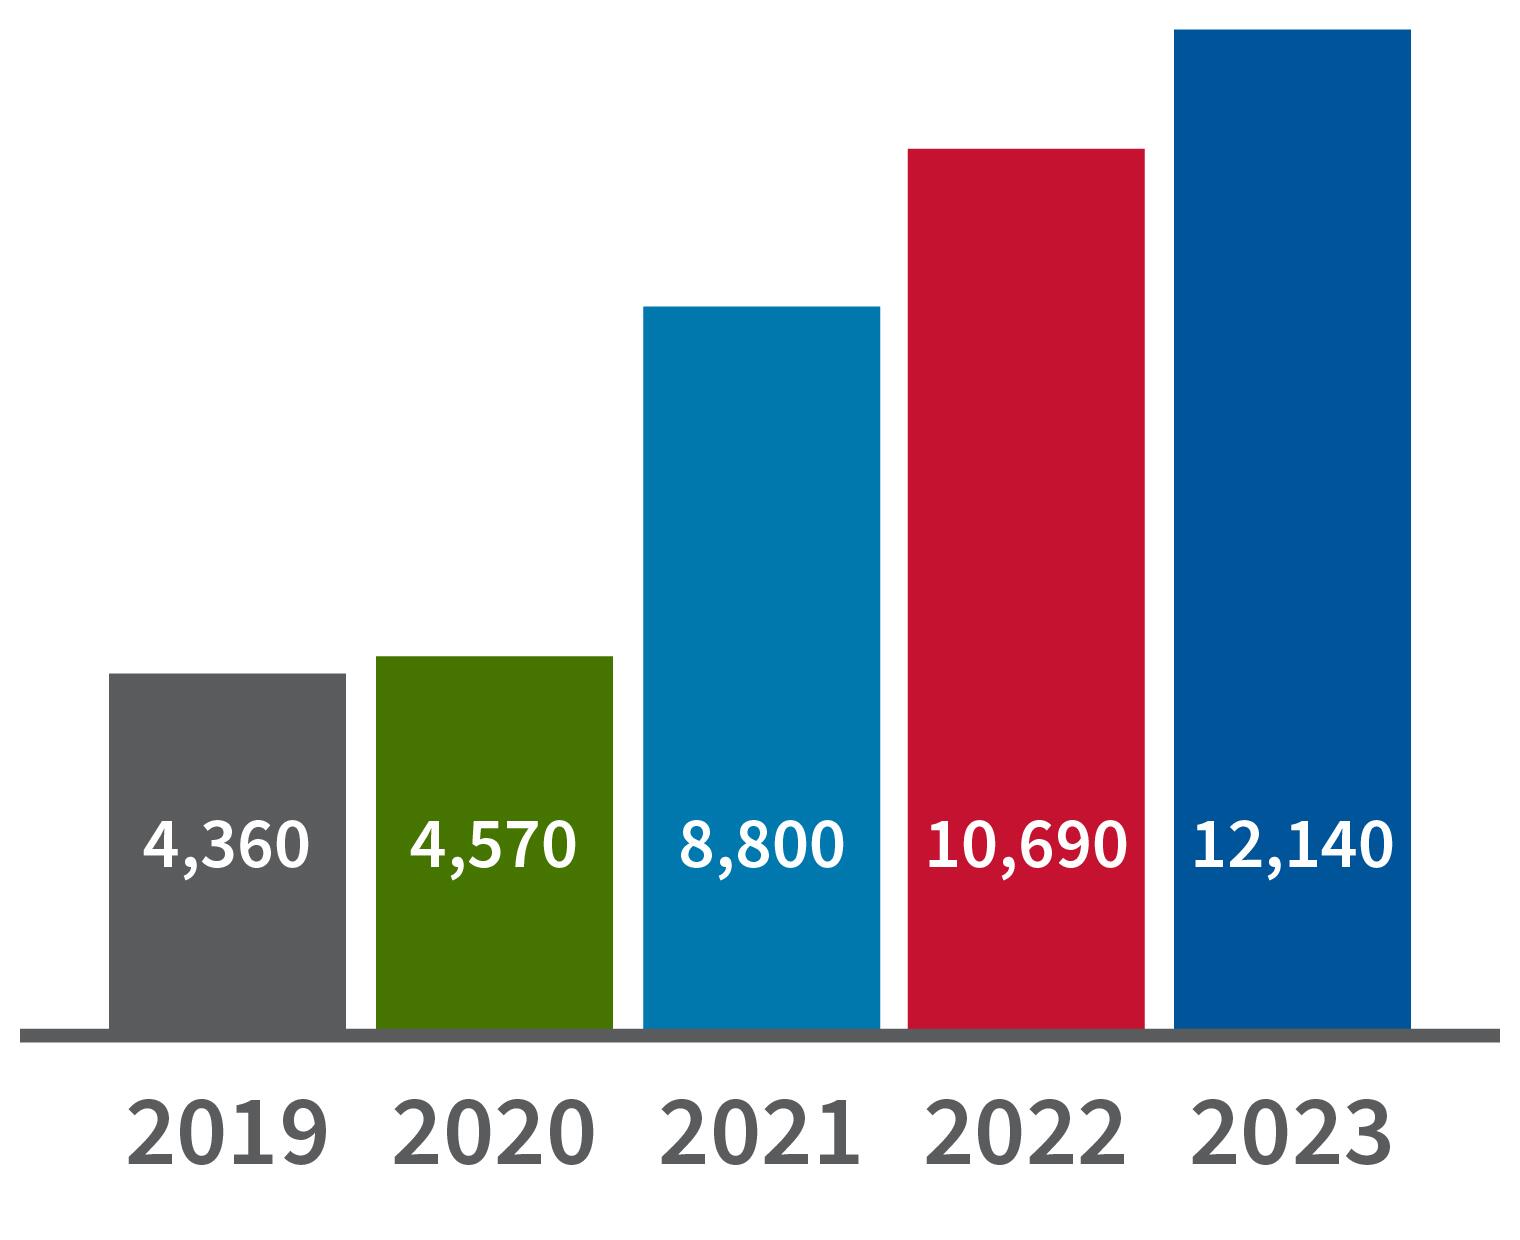
Since 2002, we have naturalized more than 170,000 members of the U.S. military, both at home and abroad. Naturalization ceremonies have taken place in more than 30 countries from Albania to the United Arab Emirates.2 In the last five years (fiscal years 2019 – 2023), we have naturalized more than 40,000 service members. In FY 2023, we naturalized more than 12,100 service members, an almost 14% increase from the previous year. Authorization for the Military Accessions Vital to the National Interest (MAVNI) program (PDF) expired on Sept. 30, 2017, contributing to a decrease in military naturalizations. The MAVNI program, authorized by the Department of Defense in 2008, allowed certain individuals who were not U.S. citizens, nationals, or lawful permanent residents to enlist if they had skills considered vital to the national interest.
Approvals by Fiscal Year (2019 – 2023)
Countries of Birth
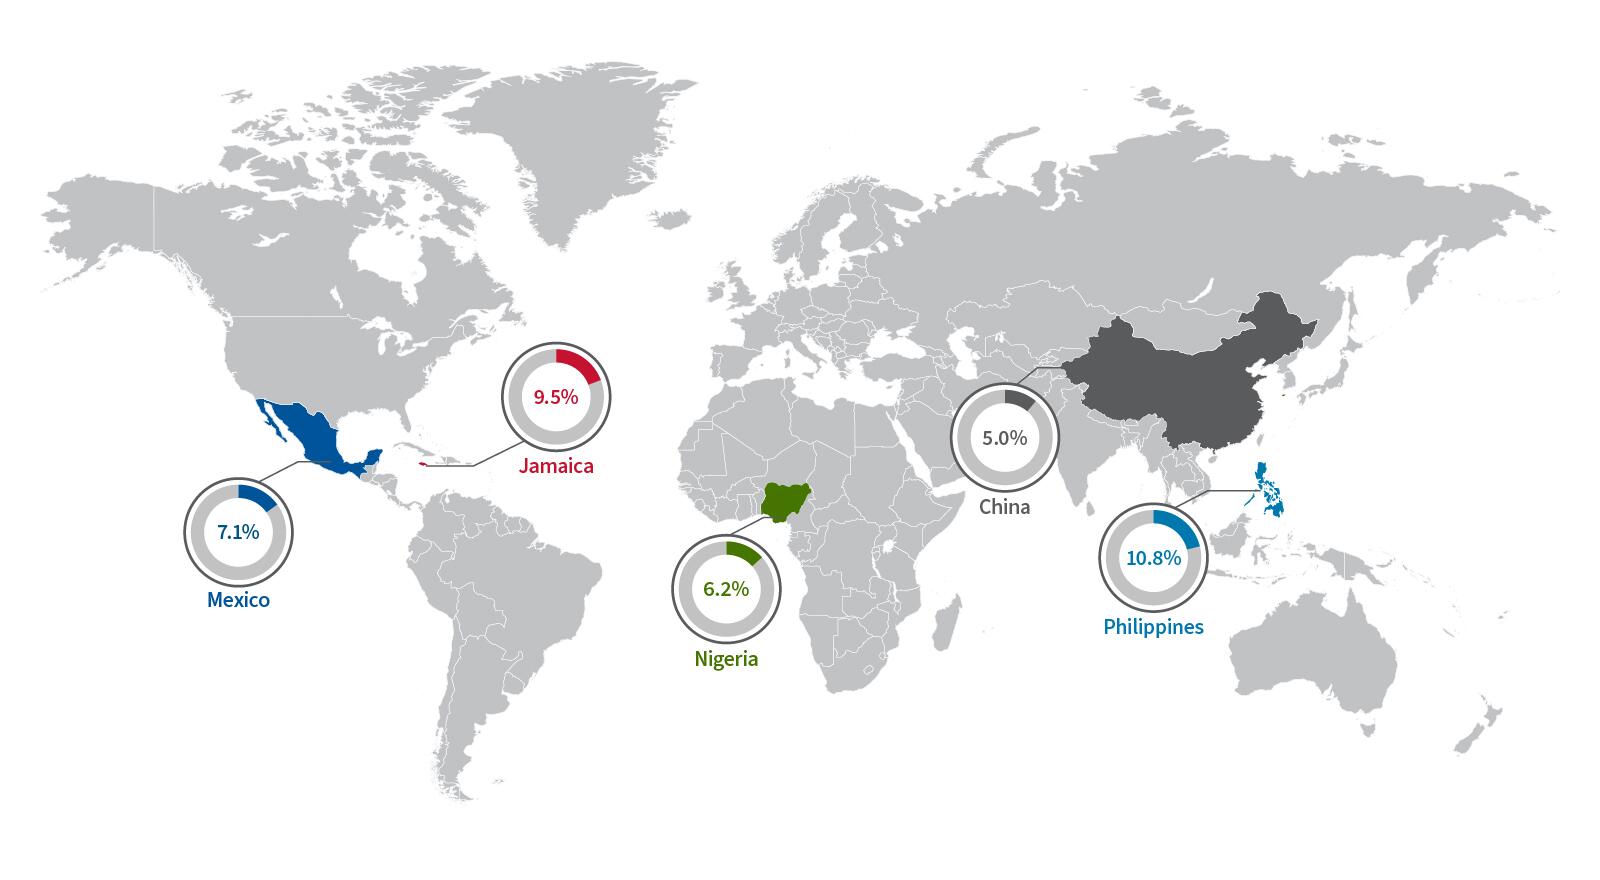
Service members born in the Philippines, Jamaica, Mexico, Nigeria, and China — the top five countries of birth among those naturalized — comprised over 38% of the naturalizations since FY 2019. The next five countries of birth — South Korea, Ghana, Haiti, Cameroon, and Vietnam — comprised an additional 17% of military naturalizations from FY 2019 to FY 2023.
Top Five Countries of Birth (FY 2019 – FY 2023)
Age
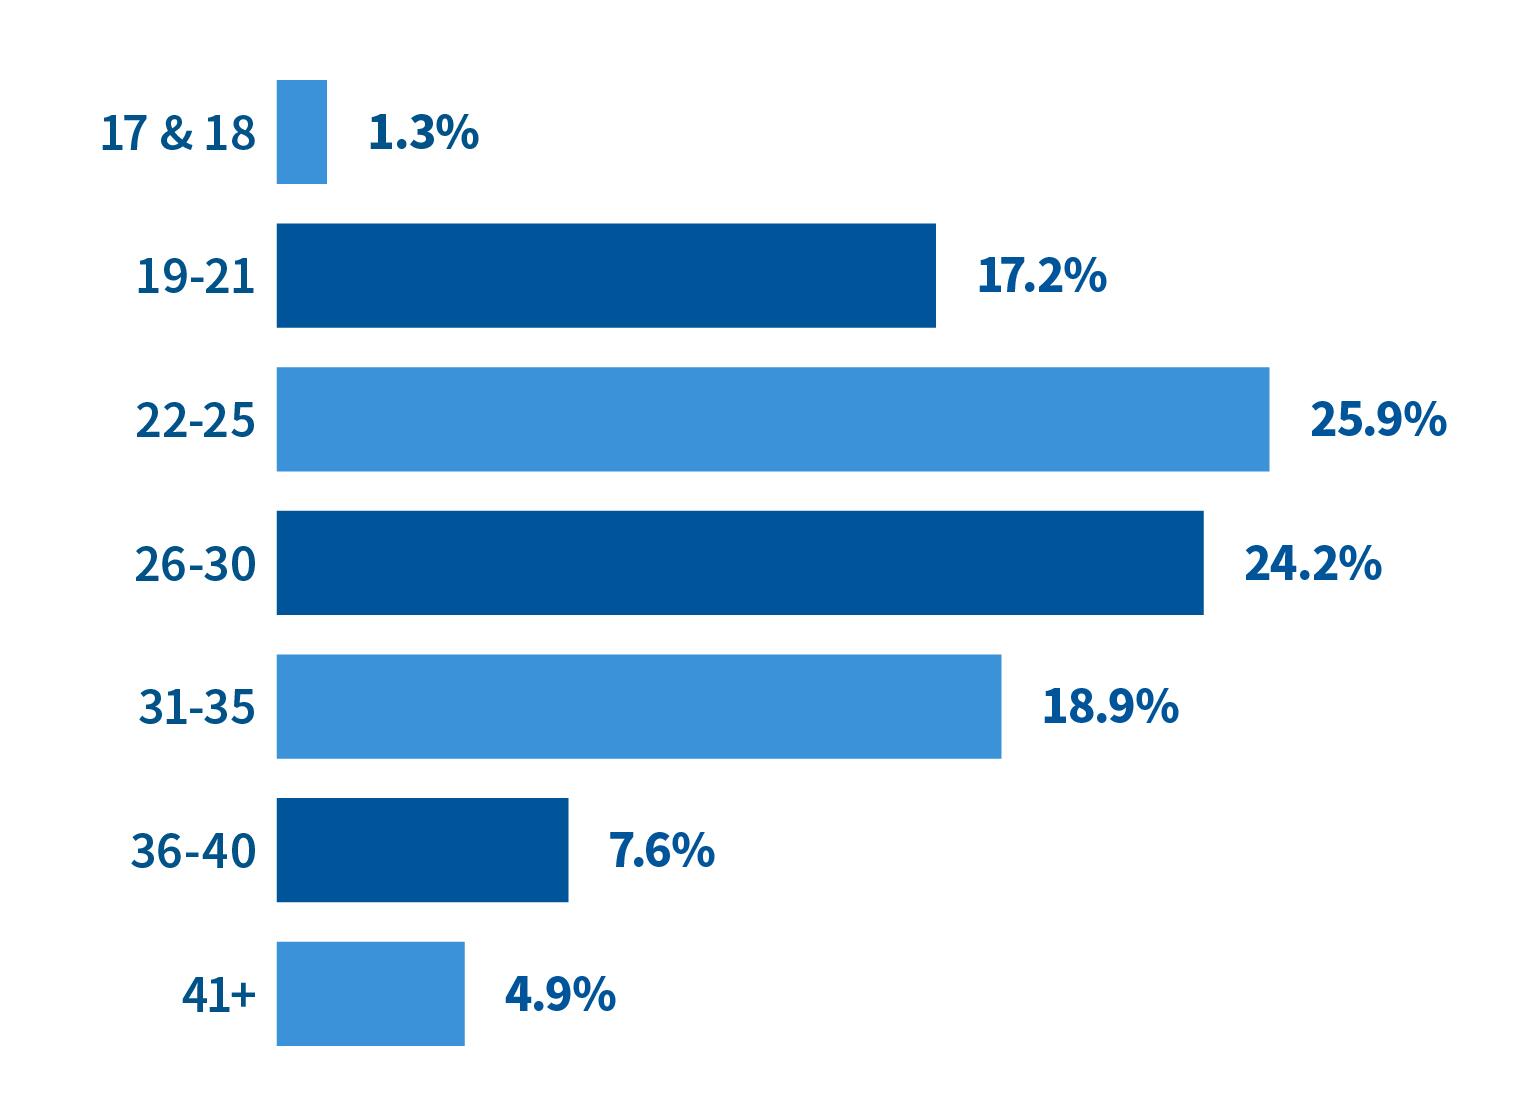
Half of all service members were between 22 and 30 years old when they naturalized. The median age of all service members who naturalized between FY 2019 to FY 2023 was 27 years old. More than 18% were 21 and under when they naturalized. Almost 5% were older than 40 when they naturalized.
Age at Naturalization (FY 2019 – FY 2023)
Gender
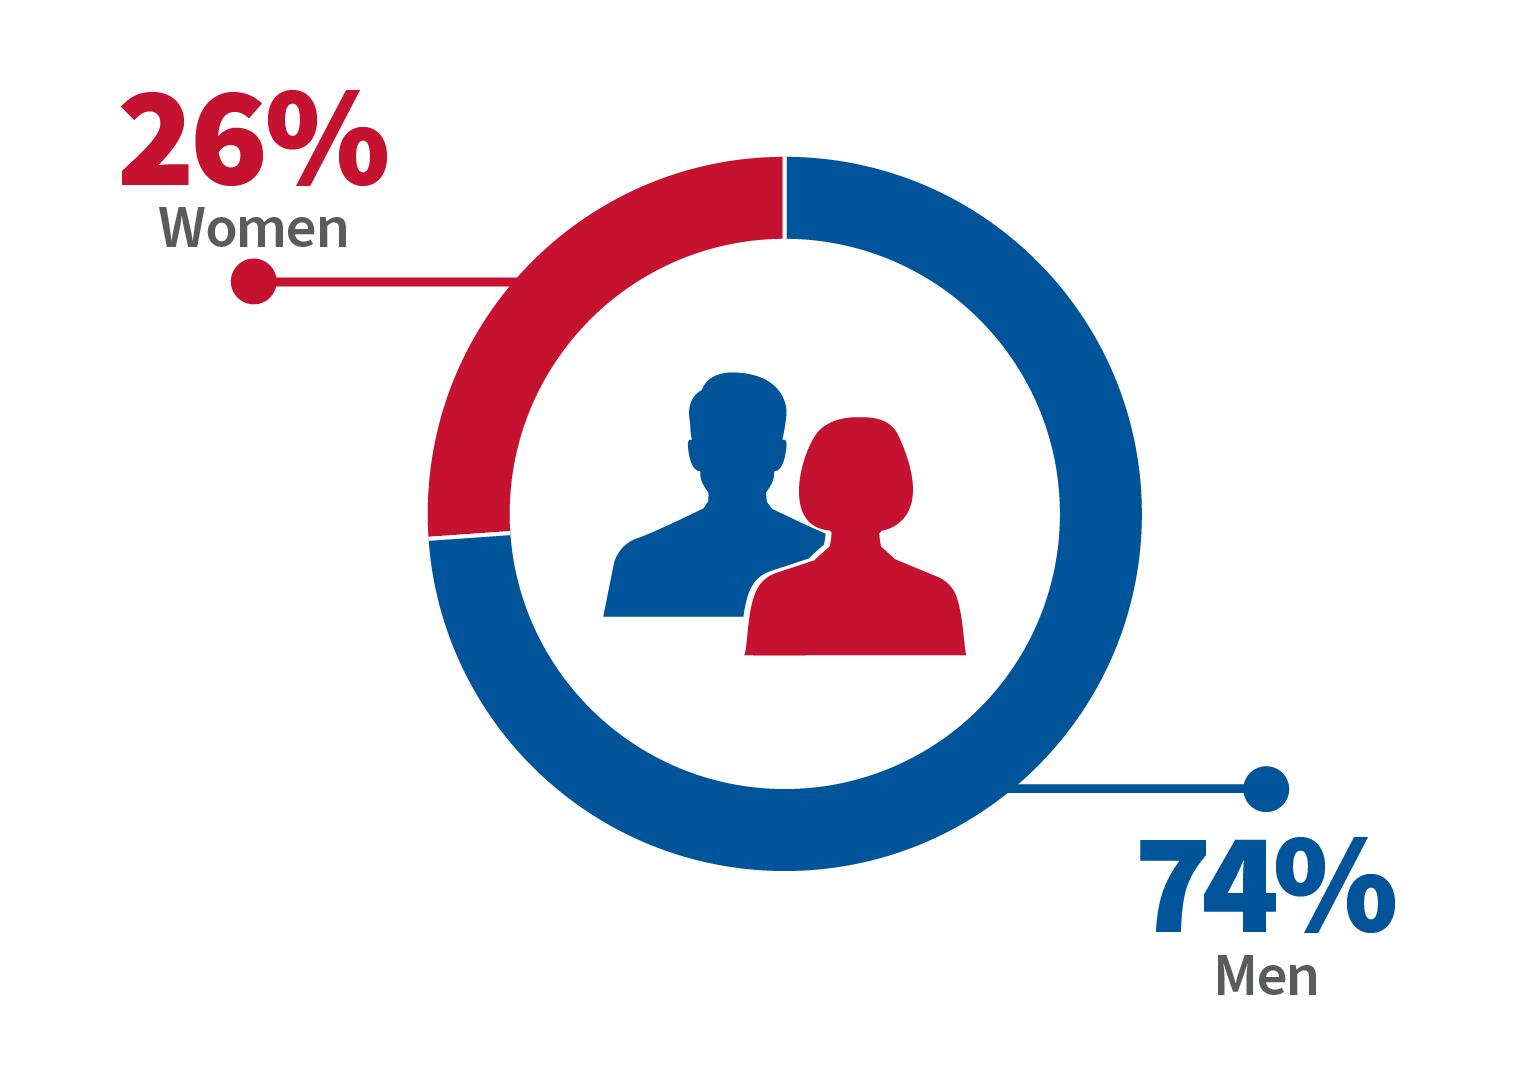
Men comprised 74% of all service members naturalized between FY 2019 and FY 2023. The proportion of male and female service members naturalized remained fairly consistent across years with the proportion of females slightly increasing since FY 2020.
Gender at Naturalization (FY 2019 – FY 2023)
Branch of Service
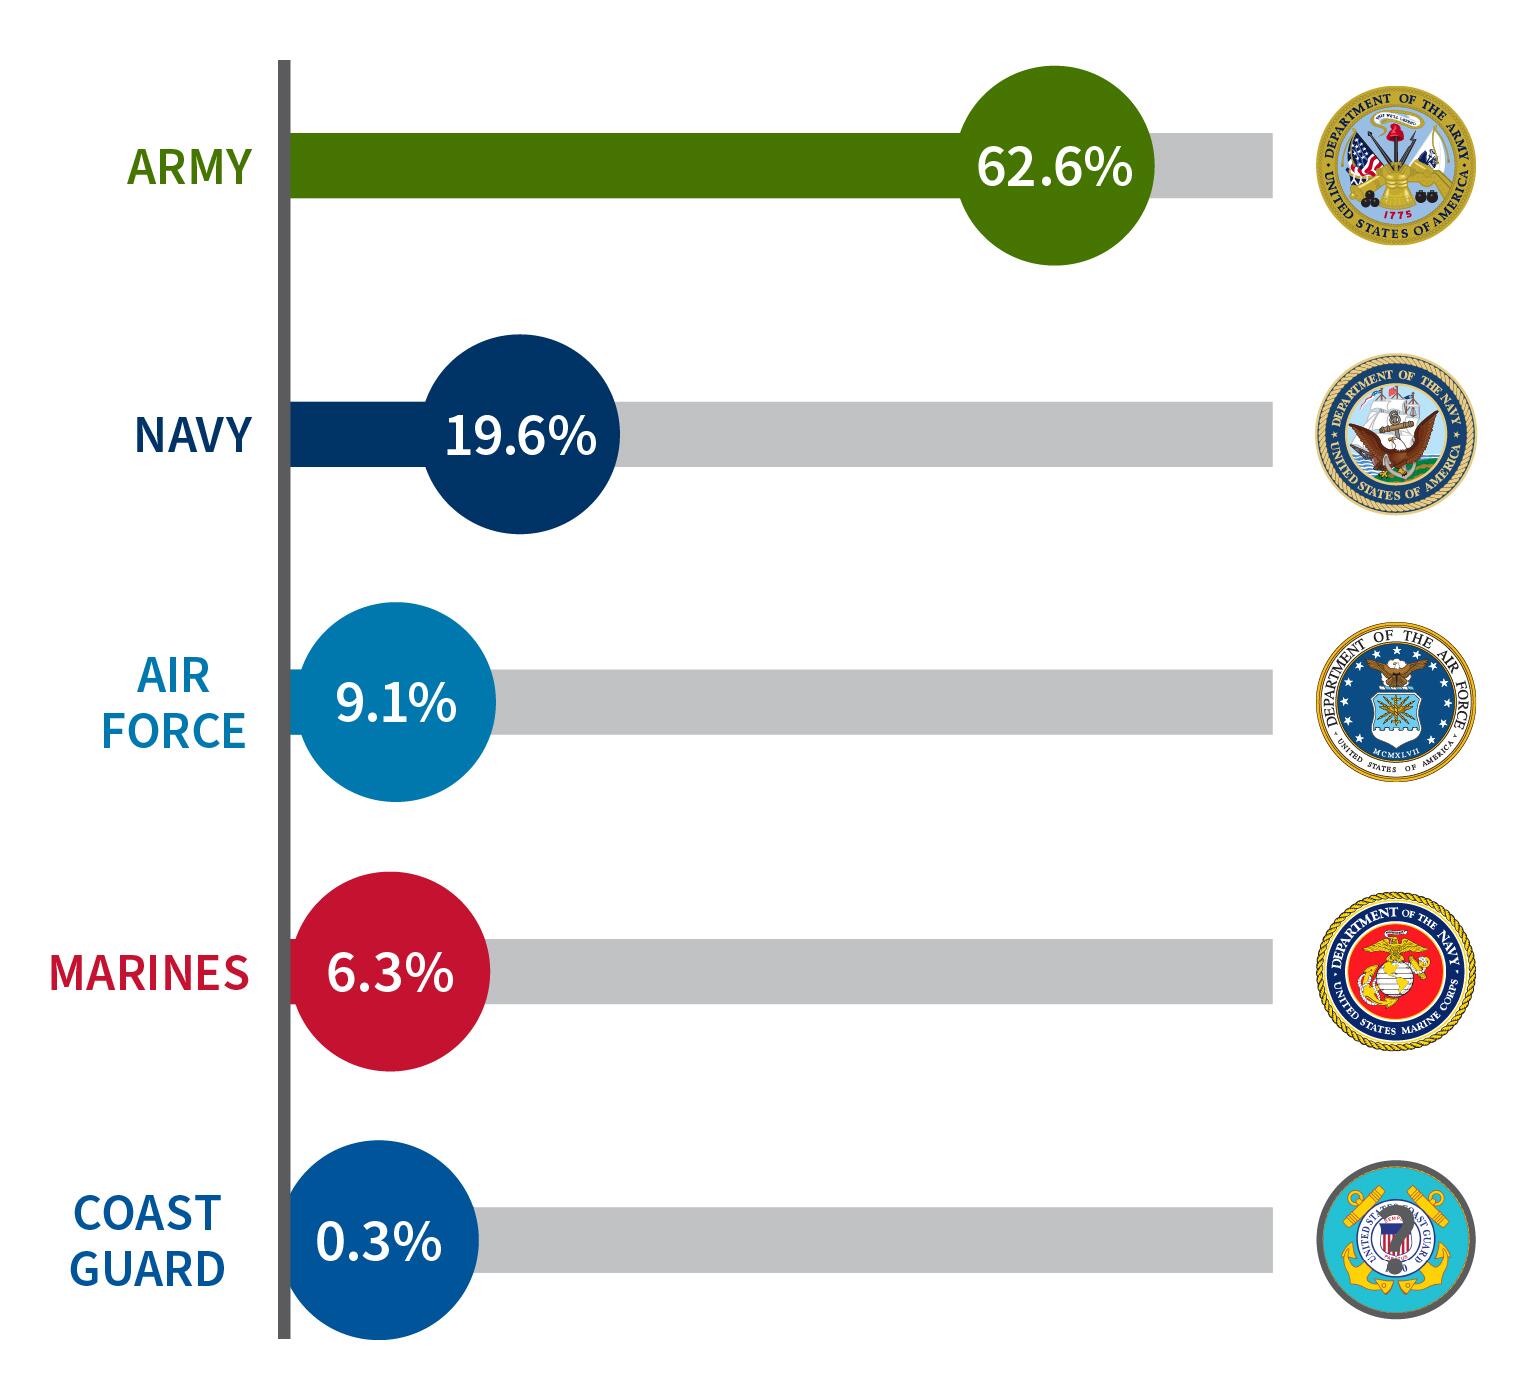
Service members from the Army (including National Guard and Reserves) comprised about two-thirds (63%) of all military naturalizations from FY 2019 to FY 2023. Service members from the Coast Guard comprised less than 1% of military naturalizations from FY 2019 to FY 2023.3
Branch of Military at Naturalization (FY 2019 – FY 2023)
Tables
| Country of Birth | FY19 | FY20 | FY21 | FY22 | FY23 | Total |
|---|---|---|---|---|---|---|
| Philippines | 410 | 460 | 940 | 1,190 | 1,390 | 4,380 |
| Jamaica | 210 | 380 | 880 | 1,090 | 1,290 | 3,850 |
| Mexico | 340 | 310 | 630 | 770 | 800 | 2,860 |
| Nigeria | 180 | 340 | 630 | 680 | 690 | 2,520 |
| China | 380 | 370 | 370 | 420 | 510 | 2,040 |
| South Korea | 510 | 280 | 260 | 310 | 330 | 1,680 |
| Ghana | 80 | 230 | 420 | 430 | 450 | 1,600 |
| Haiti | 100 | 110 | 260 | 460 | 510 | 1,430 |
| Cameroon | 60 | 130 | 280 | 340 | 370 | 1,180 |
| Vietnam | 70 | 90 | 240 | 340 | 350 | 1,090 |
| Others | 2,040 | 1,860 | 3,900 | 4,670 | 5,450 | 17,920 |
| Total | 4,360 | 4,570 | 8,800 | 10,690 | 12,140 | 40,560 |
Source: USCIS, CLAIMS 4 and ELIS. Data as of November 2023.
Notes: Due to rounding, the totals may not sum.
| Age at Naturalization | FY19 | FY20 | FY21 | FY22 | FY23 | Total |
|---|---|---|---|---|---|---|
| 17 and 18 years old | 10 | 0 | 20 | 100 | 410 | 550 |
| 19-21 years old | 620 | 520 | 1,390 | 2,020 | 2,430 | 6,970 |
| 22-25 years old | 1,070 | 1,050 | 2,210 | 2,960 | 3,210 | 10,500 |
| 26-30 years old | 1,220 | 1,270 | 2,280 | 2,450 | 2,620 | 9,830 |
| 31-35 years old | 730 | 1,110 | 1,860 | 1,950 | 2,000 | 7,650 |
| 36-40 years old | 260 | 360 | 650 | 820 | 980 | 3,070 |
| 41+ years old | 440 | 260 | 400 | 400 | 500 | 2,000 |
| Total | 4,360 | 4,570 | 8,800 | 10,690 | 12,140 | 40,560 |
Source: USCIS, CLAIMS 4 and ELIS. Data as of November 2023.
Notes: Due to rounding, the totals may not sum.
| Gender | FY19 | FY20 | FY21 | FY22 | FY23 | Total |
|---|---|---|---|---|---|---|
| Men | 3,380 | 3,450 | 6,420 | 7,740 | 8,820 | 29,820 |
| Women | 970 | 1,120 | 2,370 | 2,950 | 3,320 | 10,730 |
| Total | 4,360 | 4,570 | 8,800 | 10,690 | 12,140 | 40,560 |
Source: USCIS, CLAIMS 4 and ELIS. Data as of November 2023.
Notes: Due to rounding, the totals may not sum.
| Service Branch | FY19 | FY20 | FY21 | FY22 | FY23 | Total |
|---|---|---|---|---|---|---|
| Air Force | 180 | 430 | 860 | 840 | 1,380 | 3,690 |
| Army | 3,030 | 2,980 | 5,480 | 6,730 | 7,170 | 25,390 |
| Coast Guard | 20 | 20 | 20 | 20 | 30 | 110 |
| Marines | 240 | 220 | 520 | 750 | 830 | 2,550 |
| Navy | 450 | 830 | 1,810 | 2,230 | 2,640 | 7,960 |
| Unknown | 440 | 90 | 100 | 120 | 100 | 850 |
| Total | 4,360 | 4,570 | 8,800 | 10,690 | 12,140 | 40,560 |
Source: USCIS, CLAIMS 4 and ELIS. Data as of November 2023.
Notes: Military branches include the Reserves and National Guard; for example, the Army includes both the Army Reserves and the Army National Guard. Due to rounding, the totals may not sum.
1 Read more information on the naturalization process and eligibility for service members, veterans, and their families on our website.
2Executive Order 13269 (PDF), signed on July 3, 2002, designated the War on Terrorism (beginning on Sept. 11, 2001) as a period in which the armed forces of the United States were engaged in armed conflict with a hostile foreign force for the purposes of section 329 of the Immigration and Nationality Act (INA). As a result, those who served honorably in the armed forces on or after Sept. 11, 2001, may be eligible for naturalization in accordance with the statutory exceptions to the naturalization requirements provided in INA 329.
3 About 2% of naturalizations did not list a service branch in our system.
